The Intertropical Convergence Zone
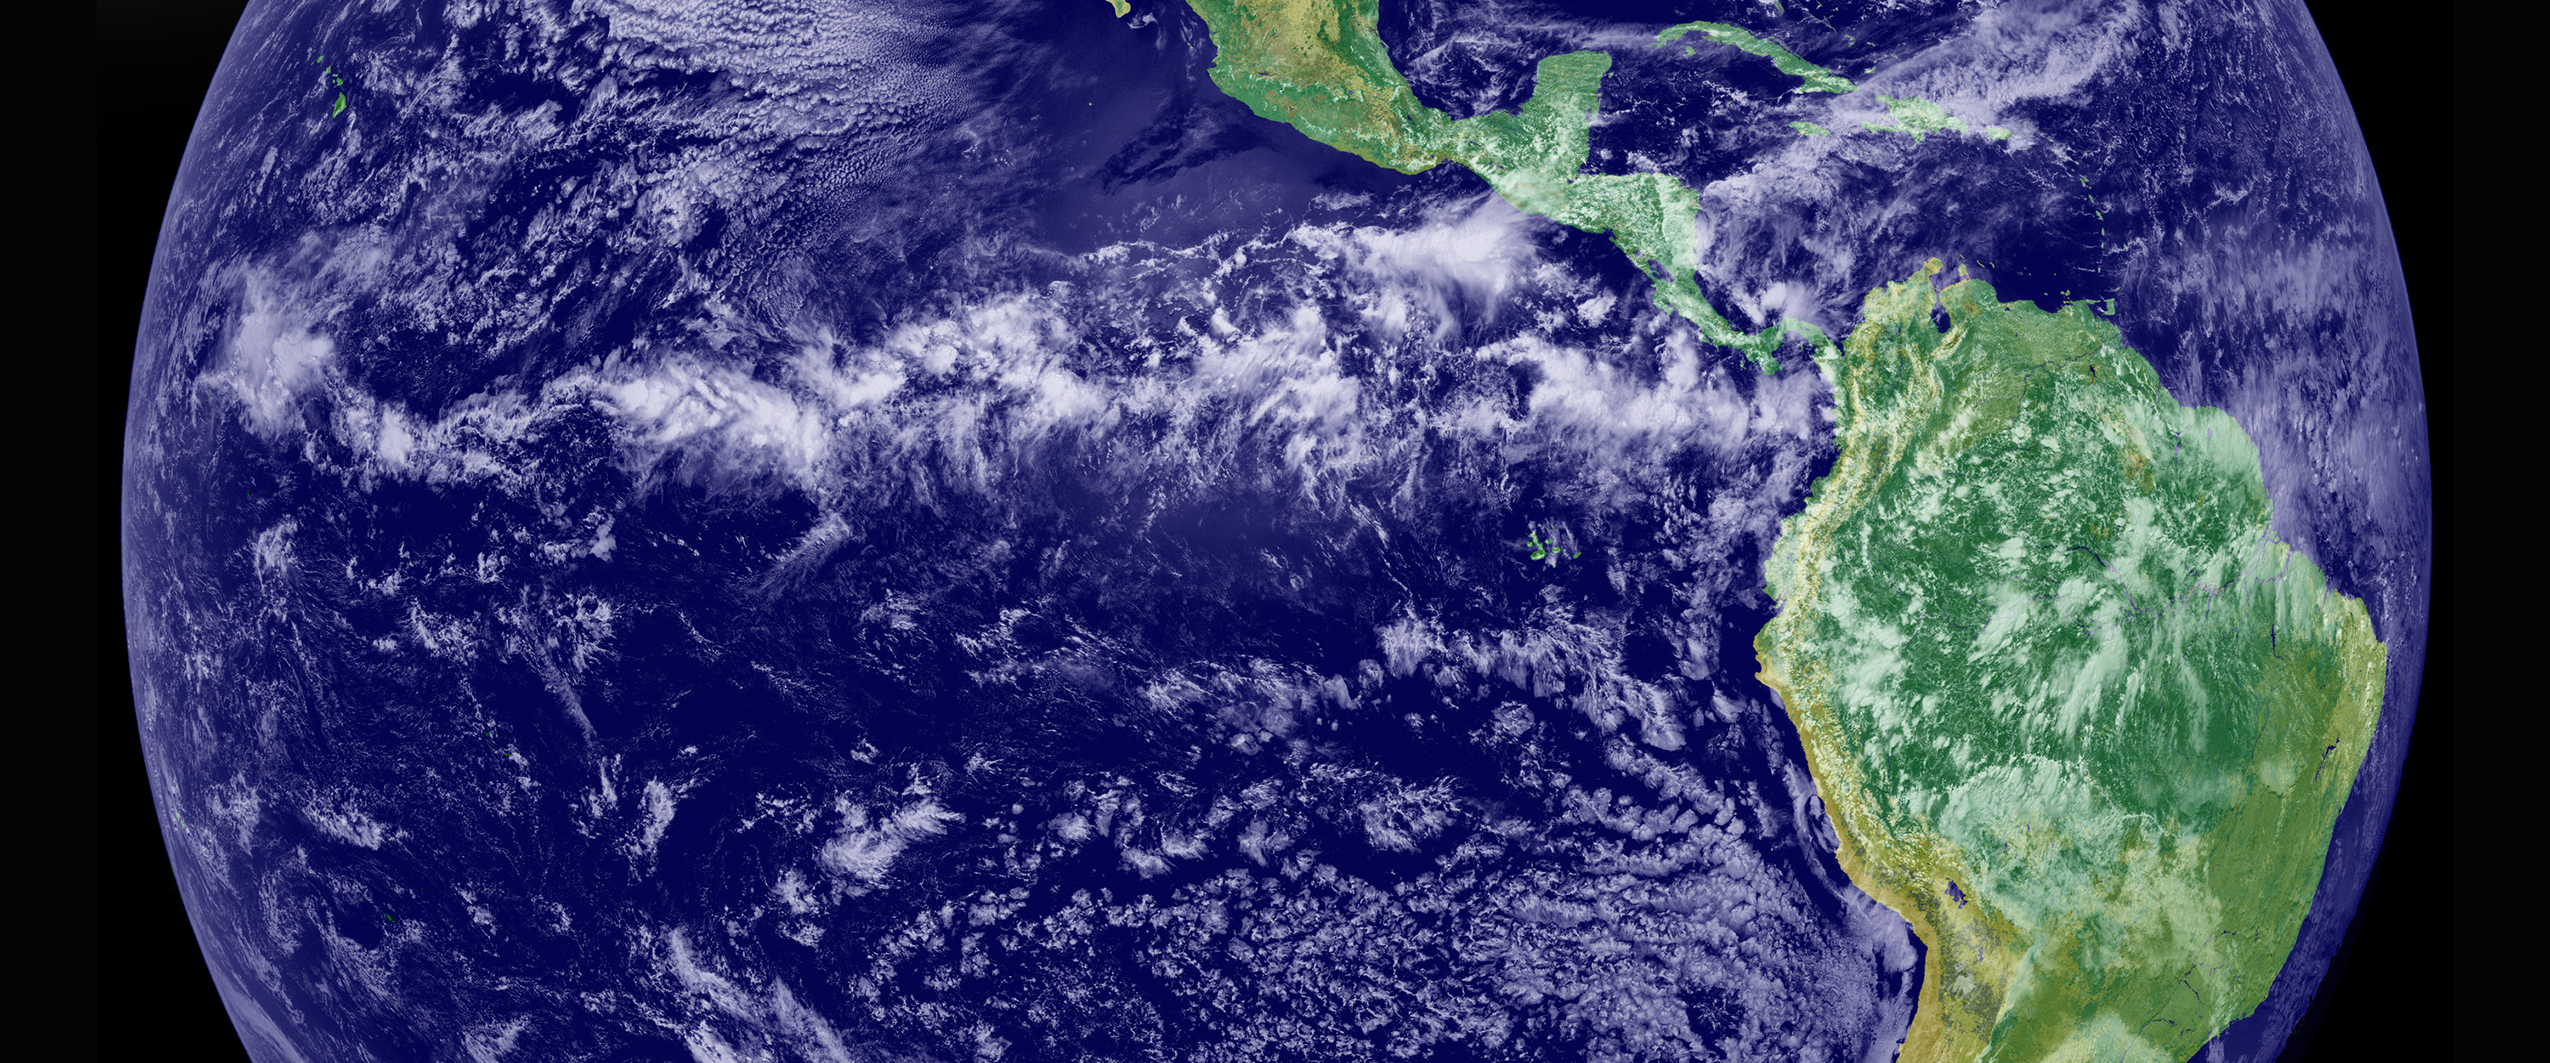
The Intertropical Convergence Zone, usually referred to as the ITCZ, is a band of unsettled weather surrounding the earth a few degrees north of the equator
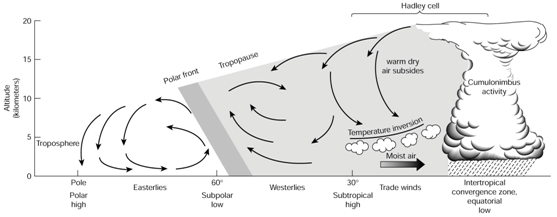
where the northeast and southeast tradewinds converge and where the sea surface temperatures reach their maximum values. It is characterized by cells of moderate to strong convection interspersed with areas of flat calm (the doldrums). The convection cells appear as tall cumulonimbus clouds reaching heights well above 20,000 feet. At the surface beneath these cells there is frequent torrential rain with thunder and lightning.
Conditions are often squally with winds from any direction. The squalls rarely exceed 35 knots. Unlike the bad weather associated with frontal systems at higher latitudes where they travel from west to east at about 20 knots or more, those in the ITCZ seem to form and dissipate in place, in other words they are stationary systems. Furthermore they can form and disappear over very short periods of time, sometimes less than 24 hours. Seas usually are moderate to small but confused since they can come from any direction or several directions at once.
The ITCZ migrates north and south following the sun, lagging it by about two months. The north-south width of the disturbed area varies from none at all to as much as 300 miles wide. The north-south seasonal boundary migration is usually between about 01N and 14N with the northern extreme occurring during August and the southern extreme during February.
During the winter and spring months, when the ITCZ is closest to the equator, cyclonic storms can not form in the ITCZ because there is negligible coriolis force close to the equator. However, small area low level cyclonic circulations (LLCC’s) up to about 120 miles in diameter with winds to 35 knots do occasionally form with very heavy rain and of course confused seas. These have the characteristics of miniature tropical disturbances. They travel east to west at 10 to 20 knots embedded in the southern boundary of the northeast trades. The strongest winds will be found in their northwest quadrant where they enhance the trades.
During the late summer months, when the ITCZ is at its maximum north migration, it experiences a larger coriolis force (actually a conservation of momentum effect rather than a force). This physical situation is an essential component of cyclogenesis leading to tropical storms and hurricanes. It is the principal reason why the highest frequency and the greatest intensities for hurricanes occur during the months of August and September.
Another tropical weather phenomenon affecting conditions along the ITCZ is the tropical wave. This is a whole subject unto itself so suffice it to say here that if one is prudent and makes passage from Mexico to the Marquesas between mid-March through the end of April, one does not have to worry about them. However, later in the season they could really spoil you day.
Should you be unfortunate enough to be making this passage late in the season then here is the stuff to watch for. Each year on average, we experience about 60 tropical waves moving east to west. They begin their journey along the coast of West Africa and march west at 10 to 15 knots eventually dissipating near the date line. They are north-south troughs lying between about 05N and 18N, about 800 to 1200 miles long. Width is about 300 miles at the surface. They occur mid-May through the end of November so that means a wave passes about every three to four days. Most pass relatively unnoticed to the cruising sailor.
Others cause a significant clockwise wind shift as they pass and some have torrential rain on the back side. A small number, about 16 in all, interact with disturbed areas in the ITCZ such that they become part of a significant tropical cyclone development, i.e. cyclogenesis. In the Northeast Pacific, all tropical storms and hurricanes have at least one tropical wave as a component of their cyclogenesis. Only about half of the tropical cyclones on the Atlantic side have such a component.
Frequently in the transition zone between the stable northeast and southeast trades there is an area of southerly winds of 5 to 20 knots over a north-south distance of up to 100 miles. Northerly winds in the transition zone are very rare. Sometimes there is sufficient separation between the convection cells that one might find a smooth transition between the northeast and southeast trades with the winds never dropping below 15 knots. If one is fortunate enough to find this condition while transiting the ITCZ, it is more likely to be blind luck than astute strategic planning. The convection cells simply form, dissipate and reform in a seemingly random fashion over periods of less than 48 hours which is far too brief a period for a slow moving vessel to effectively steer a course that will assure her of a smooth transit of the ITCZ. The location of the actual convection is rarely right over the convergence zone.
Strictly speaking, the convergence is a zone of wind convergence and the convection cells usually lie on the north side of the convergence zone with their southern boundaries close to the convergence line. This annual migration is illustrated by the climates of those islands lying in the tropics
versus those situated close to the equator.
Isla del Cocos (5-30N 87-00W) and the Palmyra Atoll (5-55N 162-05W) are both situated at about 06ºN. Although they are 4500 miles apart, they both are within the ITCZ for most of the year which is the reason they have average annual rainfalls of about 280 and 180 inches a year respectively. This accounts for the large tropical rain forests on both islands. Isla del Cocos is the more humid of the two because it is situated in the far Eastern Pacific where winds are mostly light while the Palmyra Atoll is in the Central Pacific where the trade winds are well established and consistent.
The Galapagos Archipelago (00-30N 90-40W) straddles the equator and Christmas Island (01-55N 157-25W) is only 115 miles north of the equator. Although they are 4000 miles apart, their annual rainfall is similar; about 20 and 35 inches respectively. Annual rainfall in the Galapagos is fairly consistent whereas on Christmas Island it goes through wide swings between moderate rainfall to periods of drought lasting 18 months or more.
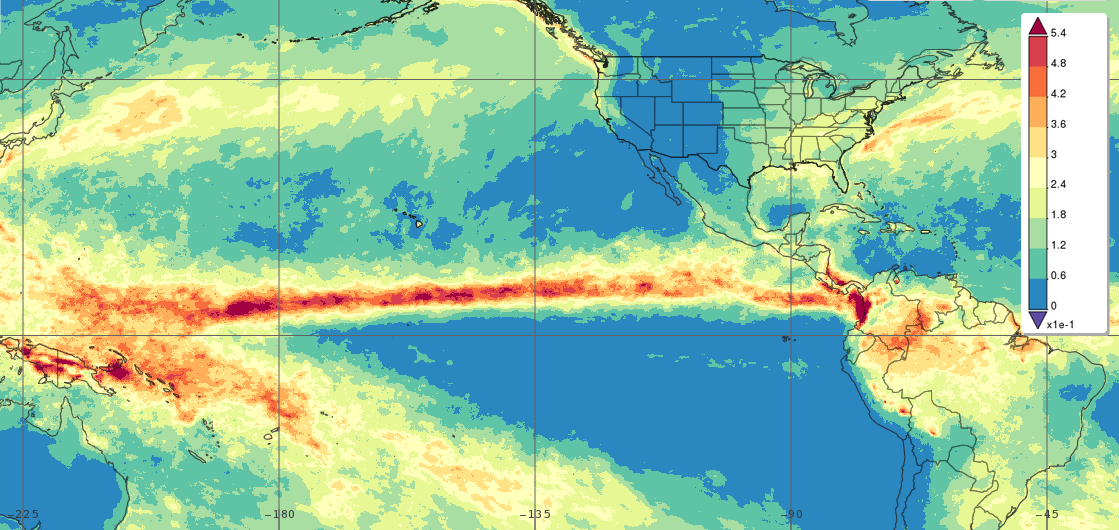
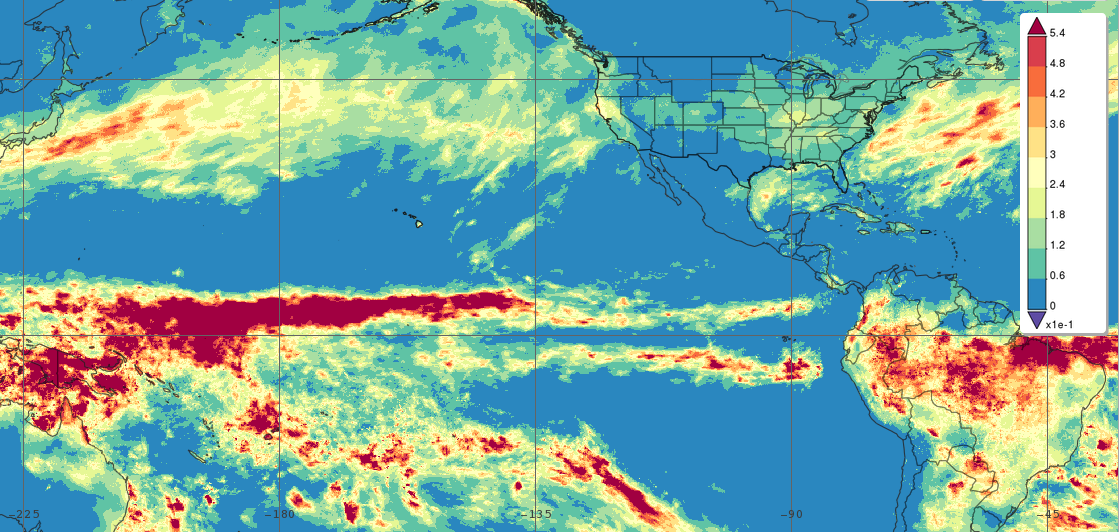
Part of the reason is the tendency of the ITCZ to thin out as it progresses west toward the Central Pacific. During a strong El Niño episode, when sea surface temperatures can be two to four degrees Celsius above normal, the trade winds are weaker and the annual rainfall in the Galapagos and Easter Island can exceed five times the average amount. As already mentioned, the recommended period for passages from Mexican ports to the Marquesas is about the middle of March through April. During this period, the ITCZ usually lies between about 03N and 07N. The north-south width of the convection cells tends to decrease towards the west, especially west of about 125W.
Note the thinning out of the ITCZ as one moves west. Of even greater significance is the change in the ITCZ over a very short period of time. These images were taken only thirteen days apart. With that in mind, note the significant shift towards the south and the essential disappearance of any convection west of 130W on March 9. This does not mean the ITCZ is moving south in a predictable manner. It
simply illustrates dramatically the large variations that can take place over very short periods of time. The distribution of convection could easily return to something like what existed thirteen days earlier. Such is the meandering variability of the convergence zone.
The location of the ITCZ is given every six hours in the NWS High Seas Forecasts. The format is a sequence of lat/lon coordinates with comments on where along the ITCZ there is moderate or strong convection. This is useful information but one should not expect it to be current. The reason is that the convection cells can develop as strong thunderstorms and then be completely dissipated over a period of less than 24 hours. Unlike thunderstorms at higher latitudes, where they move from west to east at about 20 knots, those in the ITCZ tend to remain stationary. On the other hand, the latitude or line of the ITCZ, wiggles or meanders like the Gulf Stream. For a given longitude, the north-south position of the ITCZ can vary as much as 120 miles in a 24-hour period. What all this
means is that by the time a vessel receives the ITCZ data, conditions have probably changed significantly. A slow moving vessel can not expect to find a hole in the convection chain based on information received via INMARSAT-C or USCG HF-voice weather forecasts. One might be able to improve one’s chances if one has the capability to receive (real time) the low altitude polar orbiting NOAA weather satellite infrared encoded images directly as they pass over one’s location.
Forecasting the day-to-day meanderings of the ITCZ is for me at any rate impossible. It’s rather like trying to predict which way the rabbit is going to go when I chase him across the meadow. I know he probably will stay somewhere ahead of me, but when and where will he zig or zag? The only charts I’m aware of in the public domain that come reasonably close to forecasting the ITCZ are the streamline charts generated by the USN’s NOGAPS model. But even then, one has to weight or bias them each day based on QuikSCAT scatterometer surface wind data. Computed wind vectors from scatterometer measurements are remarkably accurate. However, one has to be careful not to put too much faith in the data on the edges of the swaths or in the vicinity of very heavy precipitation.
So how does a slow moving vessel make something useful out of ITCZ data? Well, if one plots the coordinates every 24 hours, beginning several days in advance, and if one uses the same piece of paper or electronic chart, then one will have a band that shows the most probable width and location of the ITCZ. To illustrate this exercise I have plotted the daily coordinates given for the ITCZ over an eight-day period. Figure 3 shows these plots. Note the wider swings at the eastern end versus the smaller swings at the western end. Also note that during this brief period of time, the north-south swings range from about 175 to 475 miles. This illustrates my point that a slow-moving vessel can not expect to exploit the ITCZ to advantage. The rate of changes in the ITCZ far exceed the rate of progress of a slow-moving vessel.

The Optimum Intermediate Waypoint
Obviously, based on the above illustrations, there is no precise optimum intermediate waypoint. All one can say is that at this time of year it is most likely to be somewhere between 03N and 07N at about 130W. Generally one needs to remain north of the ITCZ for as long as possible. This means one makes most of one’s westing in the northeast trades. Another reason to elect this strategy is that at this time of year the northeast trades tend to be stronger than the southeast
trades. A third reason is that one is more likely to find spaces between the convection cells the further one is to the west. However, it usually is not worth sailing further than about 132W before diving south; the extra distance isn’t worth it. There is a fourth reason that has to do with the doldrums. During the recommended season, there is a good probability that the further west one goes, the more likely one will find a sharp transition between the northeast and southeast trades. Cutting the corner before the recommended waypoint, i.e. diving south, increases the probability of encountering large areas of calm. If you leave late in the season, say in June, this becomes even more probable. The reason is that the low-pressure systems forming a few hundred miles off Southern Mexico during hurricane season have the effect of markedly reducing the strength of the winds in the far southeastern corner of the tradewind belt.
A fifth reason for making most of your westing in the northeast trades as well as not leaving it too late to depart, is that as hurricane season approaches, the southeast trades in the far Eastern Pacific steadily veer, becoming southwest winds. Not only would these winds be head winds, the severity of the ITCZ weather increases as the winds shift from a convergence situation to one of shear. On reaching the ITCZ most vessels power or motor sail due south so as to cut the ITCZ at right angles in order to transit in the shortest possible time. Once one is finally in steady southeast trades one sets course directly for the Marquesas. Sometimes the southeast trades are actually east winds.
Sailing this dogleg course is about 100 miles longer than the direct great circle or rhumb line route. That’s less than three percent more than the shortest route.
While this strategy minimizes the amount of time one may be exposed to the ITCZ, one should still expect squalls at any time along the route, especially after clearing the Revillagigedos Archipelago. After all, this entire 3000-mile passage is made in the tropics.
by Dr. Donald J. Anderson